
Bridging Continuous Discovery and Continuous Delivery
How to systematically connect customer validation (Dan Olsen's Lean Product Playbook) with operational excellence to build products that matter

This publication is broken up into three sections:
TL;DR - For those wanting a quick take
Summary - For those wanting a bit more context and high level points
Article - Main body of work containing fully detailed article and explanations that you might want to consume over several readings
TL;DR
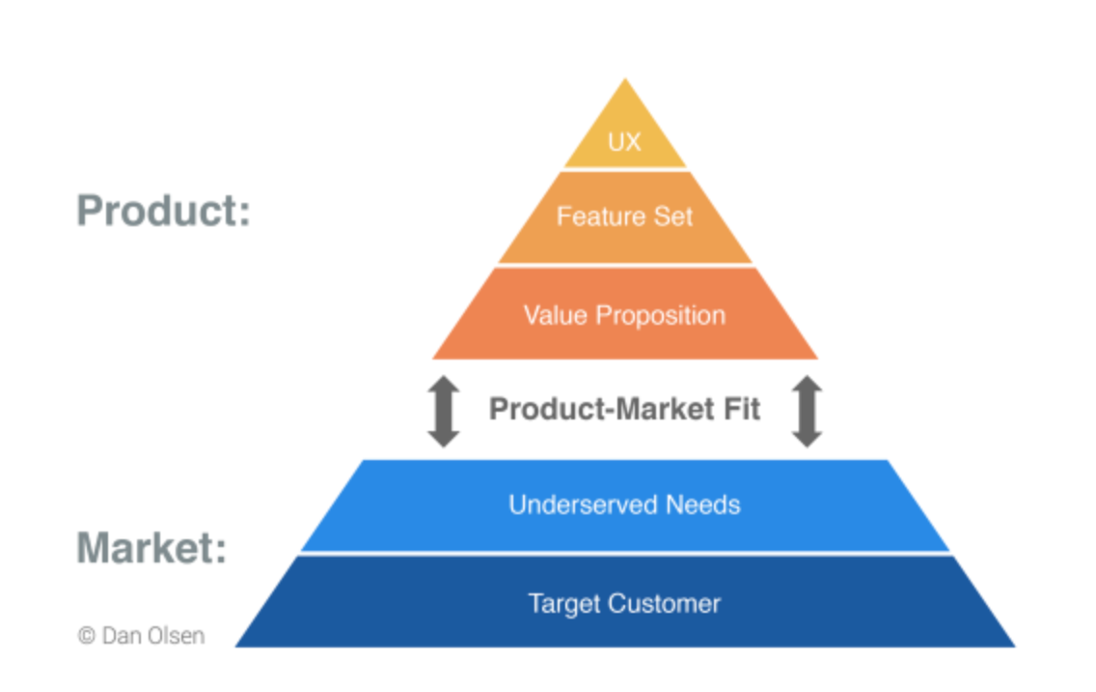
Dan Olsen’s Lean Product Playbook provides a systematic framework for product discovery through the Product-Market Fit Pyramid (Target Customer → Underserved Needs → Value Proposition → Feature Set → UX), while the Product Development Operating Model, I outlined in another article is a framework for value delivery and operational excellence. Integrating both is what is needed in an end-to-end system that reduces the 42% of startups that fail due to lack of market need.
The Problem Space versus Solution Space distinction is foundational. Teams must validate customer problems before investing in solutions, yet most operating models assume requirements are already validated, leading to efficient delivery of features nobody wants.
Hypothesis-driven development should feed validated inputs into your Logic Model. The operating model’s “Inputs” should not be arbitrary requirements but validated hypotheses from Lean Product discovery, scored using Olsen’s Opportunity formula: Importance × (1 - Satisfaction).
Flow metrics gain meaning only when connected to validated customer value. High velocity shipping unvalidated features is efficiently destroying value; the Sean Ellis 40% threshold provides a quantitative bridge between discovery validation and delivery metrics.
The integrated framework creates a dual-track system. Continuous discovery in this context is upstream and its primary function is to generate validated hypotheses, while continuous delivery runs downstream optimising flow for validated work—this is how great operators build products that achieve product-market fit.
Summary
Dan Olsen’s Lean Product Playbook introduces the Product-Market Fit Pyramid, a five-layer framework where the bottom two layers (Target Customer, Underserved Needs) represent the market you cannot control, and the top three layers (Value Proposition, Feature Set, UX) represent the product you can control, achieving product market fit requires systematic hypothesis validation across all layers.
The Problem Space versus Solution Space distinction is one of the most important mental models in product development. The Problem Space contains customer needs, pain points, and jobs to be done, while the Solution Space contains your product, features, and designs; cross-functional teams must master the Problem Space before investing in the Solution Space.
In a previous article on the Product Development Operating Model, I synthesised Donald Reinertsen’s Principles of Product Development Flow with Mik Kersten’s Flow Framework and the W.K. Kellogg Foundation’s Logic Model to create a comprehensive system for value creation, delivery and capture—integrating Olsen’s discovery methodology addresses the critical question of ‘what validated work should enter this system?’.
Hypothesis-driven development replaces the ‘traditional’ Build-Measure-Learn loop with Hypothesize-Design-Test-Learn—testing should happen before building whenever possible because “it’s faster and less costly to iterate with design deliverables than with an actual product”.
The Importance-Satisfaction Framework provides a systematic method for identifying underserved customer needs using the formula: Opportunity Score = Importance + (Importance - Satisfaction), this connects to Tony Ulwick’s Outcome-Driven Innovation methodology which has documented 86% success rates for major innovations compared to industry averages of 17%.
The Sean Ellis test provides a quantitative measure of product-market fit: asking users “How would you feel if you could no longer use this product?” with a benchmark of 40% responding “very disappointed”, this serves as a leading indicator before traditional business metrics materialise and connects discovery validation to delivery outcomes.
MVP methodology in the Lean Product framework includes multiple types (wireframes, mockups, interactive prototypes, Wizard of Oz, concierge MVPs) that map to the Logic Model as low-cost outputs designed to generate validated learning rather than immediate business value, the key insight is matching MVP fidelity to the hypothesis being tested.
Research validates the integrated approach: a 2019 randomised control trial of 116 Italian startups found that entrepreneurs using scientific hypothesis-testing approaches performed significantly better and pivoted more effectively than control groups, companies conducting 6+ months of customer research before launch showed significantly higher valuations.
One of the failure modes I have seen is teams optimising flow metrics while building features customers don’t need, the integration of Olsen’s framework solves this by making flow metrics meaningful only in context of validated hypotheses, preventing the trap of efficient value destruction.
The practical implementation requires structural changes: weekly discovery cadence, opportunity scoring before backlog entry, PMF indicators alongside flow metrics, explicit hypothesis documentation, The Product Trio (i.e., PM, Designer, Engineer) structure favoured in Technology Product Businesses ensures overlap between discovery and delivery tracks.
Article
Introduction: The Gap Between Knowing What to Build and Building It Well
With all the emphasis on agile delivery, flow metrics, and operational excellence in product development today, it is easy to forget about why we build products in the first place which from my perspective is to solve real problems for real customers in ways they value enough to pay for.
Peter Drucker once wrote:
“It is the customer who determines what a business is... What the customer thinks he is buying, what he considers ‘value’, is decisive—it determines what a business is, what it produces and whether it will prosper.”
The reality however is that most product development frameworks address only one side of the value equation. Frameworks for product discovery — like Dan Olsen’s Lean Product Playbook, Teresa Torres’s Continuous Discovery Habits, or Clayton Christensen’s and Tony Ulwicks ‘Jobs to Be Done’ — help teams understand what to build. Frameworks for product delivery—like SAFe, Scrum, Kanban, and the Flow Framework help teams to understand how to build efficiently.
What has been missing is a systematic integration that connects validated customer insights to operational execution. In an earlier article, Measure Twice and Cut Once: Products, Planning and Predictability, I synthesised Donald Reinertsen’s principles with Mik Kersten’s Flow Framework and the Logic Model to create a Product Development Operating Model focused on value delivery. In this article, I will show how Dan Olsen’s Lean Product Playbook provides the discovery engine that feeds validated work into that operating model.
I would argue that this integration is not optional, it is essential. Consider the evidence below:
42% of startups fail because there is no market need for their product (CB Insights)
70-74% of startups fail due to premature scaling—investing in delivery before validating demand (Startup Genome)
35-45% of launched products fail to meet business objectives despite being delivered on time and on budget
Companies using hypothesis-driven approaches are 3x more likely to succeed than those relying on intuition alone
Only 1 in 7 product ideas tested in controlled experiments actually improves the metrics they target (Microsoft Research)
The pattern is clear: ‘efficient delivery of unvalidated features is efficient value destruction’. The integrated framework I will present addresses this by ensuring that what enters your delivery system has already passed through systematic customer validation.
Marc Andreessen, who coined the term “product-market fit,” described it memorably:
"You can always feel product/market fit when it is happening. The customers are buying the product just as fast as you can make it—or usage is growing just as fast as you can add more servers. Money from customers is piling up in your company checking account.”
The question this article addresses is: how do we systematically work toward that state (product-market fit) rather than hoping to stumble upon it?
If you are a Product Manager, Product Leader, or anyone responsible for product development outcomes, this article will give you a practical framework for connecting discovery to delivery thereby moving your organisation from Insight to Action to Impact ©.
Part 1: Understanding Olsen’s Lean Product Playbook
Before integrating the Lean Product Playbook with the operating model, we need to understand its core components. I will walk through each major concept, providing clarity and practical context.
“What is the Lean Product Playbook and why does it matter for product development teams?”
The Lean Product Playbook, written by Dan Olsen based on his experience at Intuit and as a product management consultant to companies like Facebook, Box, and Microsoft, provides a systematic methodology for achieving product-market fit.
Olsen’s contribution is making product-market fit actionable rather than mystical. His framework provides specific tools, techniques, and processes for systematically working toward fit rather than hoping to stumble upon it. As Olsen explains: “Product-market fit is not a binary state. It’s a spectrum, and you can measure where you are on that spectrum.”
The book is organised around six key concepts that I will explore in detail:
The Product-Market Fit Pyramid
Problem Space versus Solution Space
Hypothesis-Driven Development
The Importance-Satisfaction Framework
MVP Methodology
Metrics and Analytics for Validation
Each of these concepts has direct implications for how we structure and operate product development. Let me walk through each in turn.
1.1 The Product-Market Fit Pyramid
“How do we structure our thinking about product-market fit in a way that is actionable and systematic?”
Olsen introduces the Product-Market Fit Pyramid, a five-layer model that organises the components of product-market fit from foundation to surface. This is perhaps the most important framework in the book because it makes explicit the dependencies between different aspects of product development.
Layer 1 (Base): Target Customer
This is the foundation—your specific customer segment with identified demographics, psychographics, and behavioural attributes. Olsen emphasises “peeling the onion” to get specific: not “small business owners” but “first-time small business owners in professional services with 1-5 employees who are not financially sophisticated.”
The specificity matters because different customer segments have different needs. A product that tries to serve everyone often serves no one well. As Olsen notes, you’re looking for a real, representative person, not an average of many different people.
In practice, this means creating detailed personas based on actual customer research, not internal assumptions. The persona should include:
Demographic characteristics (age, location, role, company size)
Psychographic characteristics (values, attitudes, motivations)
Behavioural patterns (how they currently solve the problem)
Context (when and where the need arises)
Layer 2: Underserved Needs
These are the customer needs that are not adequately met by current solutions. Olsen connects this to Tony Ulwick’s jobs to be done framework; customers “hire” products to get jobs done, and underserved needs represent jobs where current solutions fall short.
The key word is underserved. Many customer needs are already well-served by existing solutions. Building a better solution for a well-served need is fighting an uphill battle. The opportunity lies in needs that are important to customers but poorly addressed by current alternatives.
Olsen recommends articulating needs as customer benefit statements—statements of what the customer wants to achieve, not features or solutions. For example:
Need: “Quickly find the information I’m looking for” (benefit statement)
Not: “Full-text search” (feature/solution)
This distinction is crucial because the same customer need might be addressed by many different solutions. Keeping focus on the need rather than a specific solution keeps options open for creative solutions.
Keeping focus on the need rather than a specific solution keeps options open for creative solutions
Layer 3: Value Proposition
This defines how your product will be better than alternatives for your target customer’s underserved needs. Not just different, better in ways that matter to customers. This is where Steve Jobs’s principle applies:
“Strategy means saying no.”
Your value proposition should be specific about:
Which customer needs you address (and which you don’t)
How you’re better than alternatives on those needs
Why that difference matters to customers
Olsen uses the metaphor of a “competitive positioning map”, plotting your product against alternatives on the dimensions that matter most to customers. The goal is to find a position where you’re clearly superior on important, underserved needs.
Layer 4: Feature Set
The specific functionality your product offers to deliver on the value proposition. Olsen recommends using the Kano Model to categorise features:
Must-haves: Features customers expect as table stakes. Their presence doesn’t delight, but their absence causes dissatisfaction.
Performance features: Features where more is better. These drive satisfaction linearly—the better you are, the more satisfied customers are.
Delighters: Features customers don’t expect but love when they discover them. These drive disproportionate satisfaction.
Olsen’s recommendation: include all must-haves, focus on one main performance differentiator (your value proposition), and include at least one delighter to create positive surprise. Trying to excel on too many performance dimensions dilutes focus and resources.
Layer 5 (Top): User Experience
The design of how customers interact with your features. Good UX makes features accessible and usable; bad UX can undermine even the best feature set. As Olsen notes, UX is “the last mile” of value delivery—if customers can’t figure out how to use your features, the features might as well not exist.
UX includes:
Information architecture (how content is organised)
Interaction design (how users interact with the product)
Visual design (how the product looks)
Copy and content (how the product communicates)
The Market-Product Divide
The critical insight from this pyramid is the market-product divide: the bottom two layers (Target Customer and Underserved Needs) represent the market, which you cannot control. The top three layers (Value Proposition, Feature Set, UX) represent the product, which you can control.
One of the failure modes I have seen is teams spending enormous energy on product layers (features, UX) while having weak foundations in market layers (unclear customer, unvalidated needs). The pyramid makes explicit that you must build from the foundation up, there is no shortcut.
If your target customer is wrong, no amount of good UX will save you. If you’re solving a well-served need, no feature innovation will matter. The pyramid creates a diagnostic tool: when products struggle, work down the pyramid to find where the foundation is weak.
1.2 Problem Space versus Solution Space
“What is the most important mental model for avoiding wasted product development effort?”
I would argue that the Problem Space versus Solution Space distinction is the single most important mental model in product development. It is deceptively simple but transformative in practice.
The Problem Space contains:
Customer needs and pain points
Jobs customers are trying to accomplish
The context in which these needs arise
Current alternatives and their shortcomings
Outcomes customers are trying to achieve
The Solution Space contains:
Your product concept
Features and functionality
User interface and experience
Technical implementation
Go-to-market approach
Olsen emphasises that teams must achieve problem-solution fit before pursuing product-market fit. You cannot build the right solution if you don’t deeply understand the problem. To paraphrase his key idea:
"You want to articulate and test your problem space hypotheses before you invest significant time and resources in the solution space."
Why Teams Jump to Solutions
Despite the logic of this sequence, teams consistently jump to solutions before understanding problems. I have observed several reasons:
Solution excitement: It’s more fun to design features than to do customer research
False confidence: Teams assume they understand the problem based on internal knowledge
Stakeholder pressure: Executives often come with solution requests, not problem statements
Resource justification: Teams feel pressure to “build something” to justify their existence
Competition anxiety: “Competitors are shipping features, we need to keep up”
All of these pressures push toward premature solutioning. The integrated framework creates structural resistance, requiring problem validation before solution development.
Practical Implications
The practical implication: discovery work in the Problem Space should precede and inform work in the Solution Space. Customer interviews, observation, and research should generate validated problem hypotheses before teams begin designing and building solutions.
This has direct implications for the operating model. In a previous article, I emphasised that the Logic Model begins with Inputs—requirements that feed the value delivery system. The Problem Space/Solution Space distinction clarifies that these inputs should be validated problem hypotheses, not unvalidated solution ideas.
The sequence should be:
Understand the problem space through customer research
Validate that the problem is real, important, and underserved
Design potential solutions to the validated problem
Test solutions with customers before full development
Build the validated solution through the delivery system
Each step reduces risk for the next. By the time work enters the delivery system, the major discovery risks have been retired.
1.3 Hypothesis-Driven Development
“How do we apply scientific rigour to product development decisions?”
Olsen builds on Lean Startup methodology but makes an important refinement. Eric Ries popularised the Build-Measure-Learn loop and use of the now problematic phrase, see article (Minimum Viable Product) for more context , but Olsen argues this leads teams to build too much before learning.
His alternative is Hypothesize-Design-Test-Learn:
Hypothesize: Articulate specific, falsifiable hypotheses about customers, problems, and solutions
Design: Create the minimum design artifact needed to test the hypothesis (not a working product)
Test: Validate or invalidate the hypothesis with real customer feedback
Learn: Update your understanding and iterate
The key insight is that testing should happen before building whenever possible. As Olsen would likely confirm: “It’s faster and less costly to iterate with design deliverables than with an actual product.”
Characteristics of Good Hypotheses
Not all hypotheses are created equal. Good product hypotheses have several characteristics:
Specific: Clear about who, what, and why
Falsifiable: Possible to prove wrong with evidence
Actionable: Results will change decisions
Important: Answers a question that matters
Bad hypotheses are vague (”customers will like this”), unfalsifiable (”some people might use this”), or unactionable (the team will build the feature regardless of results).
Hypothesis Types Across the Pyramid
Each layer of the Product-Market Fit Pyramid represents hypotheses requiring validation:
Target Customer Hypothesis: “Our target customer is [specific segment] with these characteristics... We believe this because [rationale].”
Problem Hypothesis: “This customer has an underserved need for [specific job to be done]. We believe this is underserved because [current alternatives fail in these ways].”
Value Proposition Hypothesis: “Our product will be better than alternatives because [specific differentiation]. This matters to customers because [reason].”
Feature Hypothesis: “This feature set will deliver on our value proposition by [specific mechanism]. Customers will use it because [reason].”
UX Hypothesis: “This design will enable customers to easily accomplish [specific task]. We believe this because [design rationale].
Research Validation
A 2019 randomised control trial published in Management Science validated this approach. Researchers Arnaldo Camuffo and colleagues compared 116 Italian startups trained in scientific hypothesis-testing methods and compared them to a control group using traditional approaches.
Findings:
Hypothesis-driven startups performed significantly better on revenue and other metrics
They pivoted more effectively when initial hypotheses were invalidated
They made better resource allocation decisions
The effect was strongest for startups operating in uncertain markets
This provides experimental evidence that treating product development as a series of experiments produces better outcomes than intuition-driven approaches. The scientific method works for products just as it works for other domains of inquiry.
The above makes sense if you consider that when operating in spaces of uncertainty the most valuable commodity is generating data and information that enables sense-making and provides directional context. Evidence gathering and information generation is how we reduce our uncertainty about something. See articles here and here for more detail in product related contexts.
1.4 The Importance-Satisfaction Framework
“How do we systematically identify which customer needs to address?”
Not all customer needs are equal. Olsen introduces the Importance-Satisfaction Framework to prioritise opportunities. This framework, derived from Tony Ulwick’s Outcome-Driven Innovation methodology, provides a systematic way to identify underserved needs.
For each customer need, you assess two dimensions:
Importance: How important is this need to the customer? (Scale of 1-10)
Satisfaction: How satisfied is the customer with current solutions? (Scale of 1-10)
The Opportunity Score Formula
The Opportunity Score formula is:
Opportunity Score = Importance + (Importance - Satisfaction)
Or equivalently: Opportunity = Importance + Max(Importance - Satisfaction, 0)
The logic: Needs that are highly important but poorly satisfied by current solutions represent the best opportunities. A need that is important (8/10) but poorly satisfied (3/10) scores much higher than a need that is important (8/10) but already well satisfied (7/10).
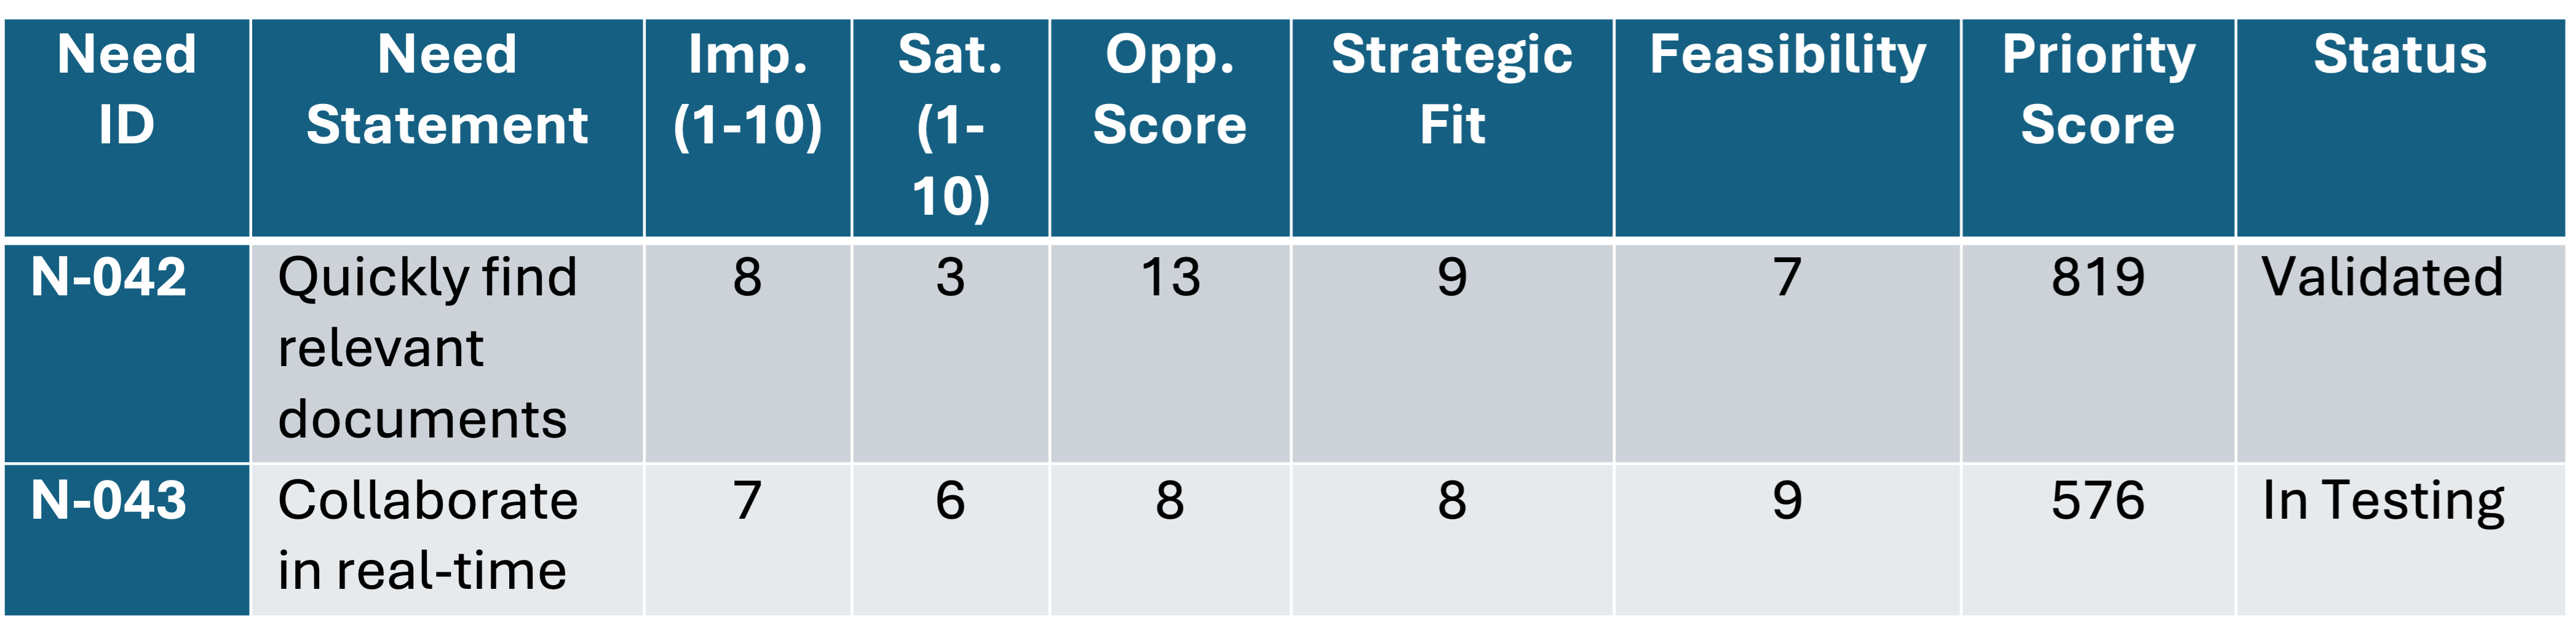
Let me illustrate with examples:
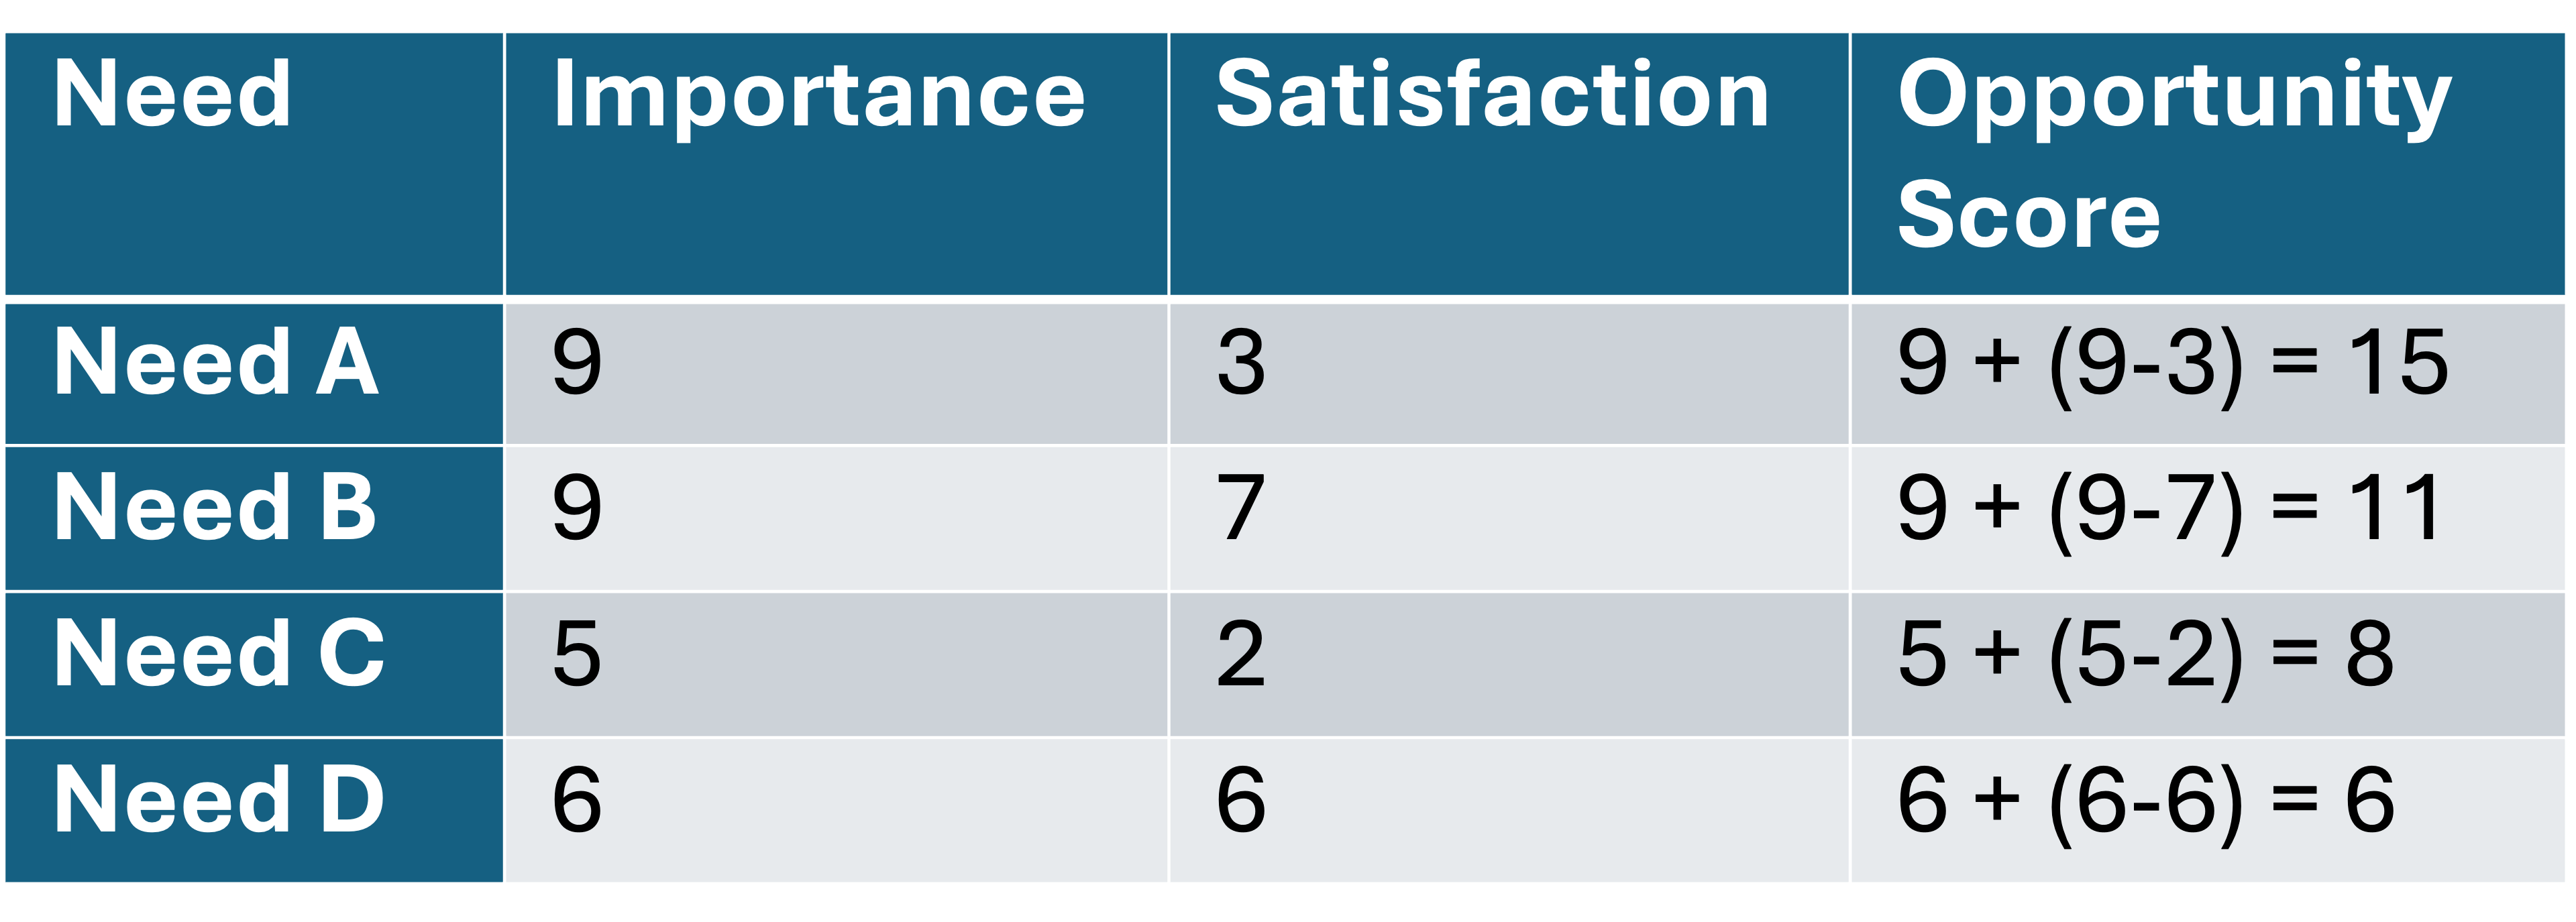
Need A represents the best opportunity — highly important and poorly satisfied. Need D represents a poor opportunity — moderately important but already adequately satisfied.
How to Gather the Data
The Importance and Satisfaction ratings should come from customer research, not internal assumptions. Olsen recommends:
Qualitative research first: Interviews to identify the relevant needs
Quantitative validation: Surveys to measure Importance and Satisfaction across a larger sample
Segment analysis: Breaking down scores by customer segment to find pockets of opportunity
The survey might ask:
“How important is [need statement] to you?” (1-10)
“How satisfied are you with your current solution for [need statement]?” (1-10)
Validation Track Record
This framework connects directly to Tony Ulwick’s Outcome-Driven Innovation methodology, which has documented success rates of 86% for major innovations compared to industry averages of 17%. The systematic identification of underserved needs dramatically improves product success rates.
For the operating model integration, this framework provides prioritisation criteria for what enters the delivery system. Features addressing high-opportunity needs should flow through the system faster than features addressing already-satisfied needs.
1.5 MVP Methodology
“What is the right way to think about Minimum Viable Products in the context of systematic discovery?”
The term MVP has been widely misused to mean “first version of the product” or “product with minimal features.” Olsen returns to the original intent: an MVP is the minimum artifact needed to test a hypothesis.
The word “viable” doesn’t mean “shippable as a product”, it means “capable of generating validated learning.” An MVP that invalidates a hypothesis is viable even if it never becomes a product.
MVP Fidelity Levels
Olsen categorises MVPs by fidelity and effort:
Low-Fidelity MVPs (for early problem/concept validation):
Problem interviews: Conversations to understand customer needs and pain points
Solution interviews: Presenting a concept (not a product) and gathering feedback
Landing page tests: Describing the product and measuring signup interest
Explainer videos: Demonstrating the concept before building anything
Fake door tests: Adding a button for a feature that doesn’t exist to gauge interest
Medium-Fidelity MVPs (for value proposition validation):
Wireframes and mockups: Static designs showing the proposed solution
Interactive prototypes: Clickable prototypes that simulate the experience
Wizard of Oz MVPs: Humans manually perform what the product would automate (customer thinks it’s automated)
Concierge MVPs: High-touch manual service before building the product
High-Fidelity MVPs (for feature and UX validation):
Live product with limited features: Actual working product with reduced scope
A/B tests: Comparing different solutions with real usage
Beta programmes: Limited release to gather feedback before broad launch
Single-feature products: Building one core feature to test market response
Matching MVP to Hypothesis
The key insight: match MVP fidelity to the hypothesis being tested. Testing whether a problem exists doesn’t require a working product, interviews suffice. Testing whether users will pay requires something they can actually purchase.
The Dropbox Example
Dropbox provides the canonical example. Drew Houston needed to test demand for cloud file syncing, but building the actual product required significant engineering investment. His MVP: a 3-minute explainer video demonstrating the concept.
The video was targeted at tech-savvy early adopters on Digg (his target customer segment). Result: signups grew from 5,000 to 75,000 overnight. This validated demand before significant development investment.
The “MVP” wasn’t a minimal product, it was a minimal artifact (video) that tested a specific hypothesis (demand exists for this solution).
MVPs in the Logic Model
In the Logic Model framework, MVPs are outputs designed to generate learning outcomes rather than business outcomes. This is a critical distinction. The success metric for an MVP is not revenue or adoption, it’s validated learning that informs the next iteration.
This requires adjusting how we measure MVP activities towards what some like Strategyzer would refer to as Innovation Accounting and Associated metrics. Rather than flow metrics (velocity, cycle time), we measure learning metrics (hypotheses tested, validation rate, time to learning).
1.6 Metrics and Analytics for Validation
“How do we know when we have achieved product-market fit?”
Olsen provides both qualitative and quantitative measures for assessing progress toward product-market fit.
Qualitative Indicators of Product-Market Fit
Before metrics materialise, qualitative signals can indicate progress:
Customers actively requesting features and upgrades
Word-of-mouth referrals happening organically
Sales cycles shortening as product reputation spreads
Customers reluctant to switch even when offered alternatives
Users finding workarounds for missing features (showing deep engagement)
Customer testimonials that articulate specific value received
Low churn despite competitive alternatives
The Sean Ellis Test
The most actionable quantitative measure is the Sean Ellis Test. Sean Ellis, who coined the term “growth hacking” and led growth at Dropbox and LogMeIn, developed a simple survey question:
“How would you feel if you could no longer use [product]?”
- Very disappointed
- Somewhat disappointed
- Not disappointed
- N/A - I no longer use [product]
The benchmark: if 40% or more respond “very disappointed,” you have achieved product-market fit. This threshold was validated across hundreds of startups and has become an industry standard.
The logic: If less than 40% of users would be very disappointed without your product, you haven’t created enough value. Users may find alternatives or simply do without. Above 40%, you’ve created something users consider essential.
Implementing the Sean Ellis Survey
Practical considerations for running the survey:
Target: Users who have experienced the core value (not new signups)
Sample size: Minimum 40-50 responses for statistical significance
Timing: After users have had sufficient time to experience value (varies by product)
Segmentation: Break down results by customer segment—you may have PMF with some segments but not others
Additional Metrics for Validation
Beyond the Sean Ellis score, Olsen recommends tracking:
Retention Cohorts: Are users coming back after initial use? Plot retention curves by cohort (e.g., week 1, week 2, etc.). A flattening curve indicates users are finding ongoing value; a curve that declines to zero indicates users try the product but don’t stick.
Net Promoter Score (NPS): “How likely are you to recommend [product] to a friend or colleague?” (0-10). Promoters (9-10) minus Detractors (0-6) equals NPS. Above 50 is excellent; above 70 is world-class.
Customer Acquisition Cost vs. Lifetime Value: Is growth economically viable? CAC/LTV ratio below 1:3 is typically unsustainable; above 1:3 indicates room for profitable growth.
Feature Usage Analytics: Are users engaging with key features? Track adoption of features that deliver your core value proposition. Low usage of key features suggests UX problems or misaligned value proposition.
Conversion Metrics: At each stage of the customer journey, what percentage advance? Identify where customers drop off—this reveals where value delivery fails.
These metrics provide the outcome measures that connect discovery validation to delivery success. They answer the question: did the features we delivered actually create customer value?
Part 2: The Product Development Operating Model Recap
Before explaining the integration, let me briefly recap the key elements of the Product Development Operating Model from a prior article.
“What are the essential components of an operating model for product development?”
The operating model I proposed synthesises three frameworks to create a coherent system for value creation, delivery and capture:
Donald Reinertsen’s Principles of Product Development Flow
Reinertsen argues that product development should be managed using economic decision-making principles, optimising for the economics of the entire system rather than local efficiency metrics. Key principles include:
Quantifying the Cost of Delay: Every day a feature is delayed has an economic cost. Then you can prioritise work based on cost of delay, not just value or effort. Useful technique for established businesses and products that have data that can be used for forecasting.
Managing queues and Work-in-Progress (WIP): Queues create delay; excessive WIP creates context-switching. Limit both.
Reducing batch sizes: Smaller batches flow faster and provide earlier feedback.
Understanding variability: Variability is inherent to development; manage it rather than pretending it doesn’t exist.
Decentralising control: Push decisions to where information exists rather than escalating everything.
Mik Kersten’s Flow Framework
Kersten provides four flow metrics for measuring value delivery:
Flow Velocity: How many items are completed per time period? Measures throughput.
Flow Time: How long does an item take from start to finish? Measures responsiveness.
Flow Efficiency: What percentage of time is active work versus waiting? Reveals waste.
Flow Load: How much work is in progress at any time? Indicates system stress.
These metrics apply to flow items — features, defects, debt, and risk — that move through the value stream.
The W.K. Kellogg Foundation Logic Model
The Logic Model provides a structure for connecting activities to outcomes:
Inputs: Resources and requirements entering the system
Activities: Work performed to create value
Outputs: Deliverables produced
Outcomes: Changes resulting from outputs (short, medium, long-term)
Goals: Ultimate objectives the system serves
The Warning About Metrics
I have previously argued (here) that product development teams must focus on flow efficiency and meaningful metrics, but I also warned that metrics can be gamed. As I noted: “A short flow time is not indicative of high quality and/or high output does not necessarily mean product development teams are delivering value.”
This warning points directly to the need for Lean Product integration: flow metrics only matter when the work flowing through the system creates validated customer value. A team with excellent flow velocity shipping unvalidated features is efficiently destroying value.
The operating model provides the machinery for delivery; the Lean Product Playbook provides the validation that makes delivery meaningful.
Part 3: The Integration Framework
Now we arrive at the core contribution of this article which is a systematic integration of Lean Product Discovery with the Product Development Operating Model.
“How do we connect customer validation to operational execution in a coherent framework?”
The integration operates at four levels:
Inputs: Validated hypotheses replace arbitrary requirements
Activities: Discovery and delivery run as parallel tracks
Outputs: MVPs and features serve different purposes
Outcomes: Customer validation metrics complement flow metrics
Let me walk through each level in detail.
3.1 Integrating Inputs: Validated Hypotheses as Requirements
The Logic Model begins with Inputs—the requirements that feed the value delivery system. In most organisations, these inputs come from various sources: executive requests, sales team feedback, competitor analysis, customer support tickets, and product manager intuition.
One of the failure modes I have seen is treating all these inputs as equally valid. An executive’s feature request is given the same weight as a validated customer need. A competitor’s feature is copied without understanding if it addresses a need for your target customers.
The Lean Product Discovery integration transforms this by establishing that all inputs should be validated hypotheses with evidence of customer need.
The Validation Gate
Before any feature enters the delivery system, it should pass through a validation gate.
See example below:
Features without validation evidence should remain in the discovery track, not enter the delivery/development backlog. This prevents the common failure mode of optimising flow for unvalidated work.
Handling Exceptions
Some may argue that this creates too much friction—that urgent business needs require faster movement. The reality however is that bypassing validation doesn’t eliminate risk; it just delays discovering the problem until after significant resources have been invested.
For truly urgent situations, I would suggest a compromise: allow features to enter delivery with explicit acknowledgment of unvalidated risk. Track these separately, and ensure the organisation knows it’s taking a bet without customer validation. Often, making the risk explicit leads to a decision to validate first after all.
Opportunity Scoring for Prioritisation
Within validated items, prioritisation uses the Importance-Satisfaction framework extended with business factors:
Priority Score = Opportunity Score × Strategic Alignment × Feasibility
Where:
Opportunity Score = Importance + (Importance - Satisfaction)
Strategic Alignment = fit with business strategy (1-10)
Feasibility = technical and resource feasibility (1-10)
This creates a contextually relevant prioritisation system that balances customer value with business reality. It’s not purely customer-driven (some customer needs may not align with strategy) nor purely business-driven (some strategic initiatives may not address customer needs).
3.2 Integrating Activities: The Dual-Track System
The most significant structural change is implementing dual-track development—a concept advocated by Marty Cagan of Silicon Valley Product Group and claimed to be adopted by high-performing product organisations.
“How do we structure team activities to support both discovery and delivery?”
The dual-track system runs two parallel processes:
Discovery Track
The discovery track runs continuous exploration using Lean Product Discovery methods:
Weekly Example of Activities:
Customer interviews (Teresa Torres recommends weekly touchpoints by the team building the product)
Prototype testing sessions
Problem space research (observation, contextual inquiry)
Competitor and alternative analysis
Data analysis of existing product usage
Example Outputs:
Validated/invalidated hypotheses
Updated Importance-Satisfaction scores
MVP test results
Customer insight documentation
Updated personas and journey maps
Example Success Metrics:
Number of hypotheses tested per week/sprint
Customer interview velocity
Time from hypothesis to validation/invalidation
Quality of insights generated (assessed qualitatively)
Size of validated backlog ready for delivery
Delivery Track
The delivery track runs continuous execution on validated work using the flow principles from the operating model:
Example Inputs:
Only features that passed the validation gate
Prioritised by combined Opportunity and Strategic score
Clear acceptance criteria tied to validated customer needs
Example Activities:
Design, development, testing, deployment
Managed using flow principles (WIP limits, queue management, small batches)
Quality practices (code review, automated testing, continuous integration)
Example Outputs:
Working software meeting acceptance criteria
Released features available to customers
Technical documentation
Instrumentation for ongoing measurement
Example Success Metrics:
Flow velocity (validated features shipped)
Flow time (cycle time for validated items)
Flow efficiency (active work vs. wait time)
Flow load (WIP for validated items)
Quality metrics (defect rates, production incidents)
Delivery predictability (forecast accuracy)
The Handoff Process
The interface between tracks is critical. A poorly designed handoff creates bottlenecks or allows unvalidated work to leak into delivery.
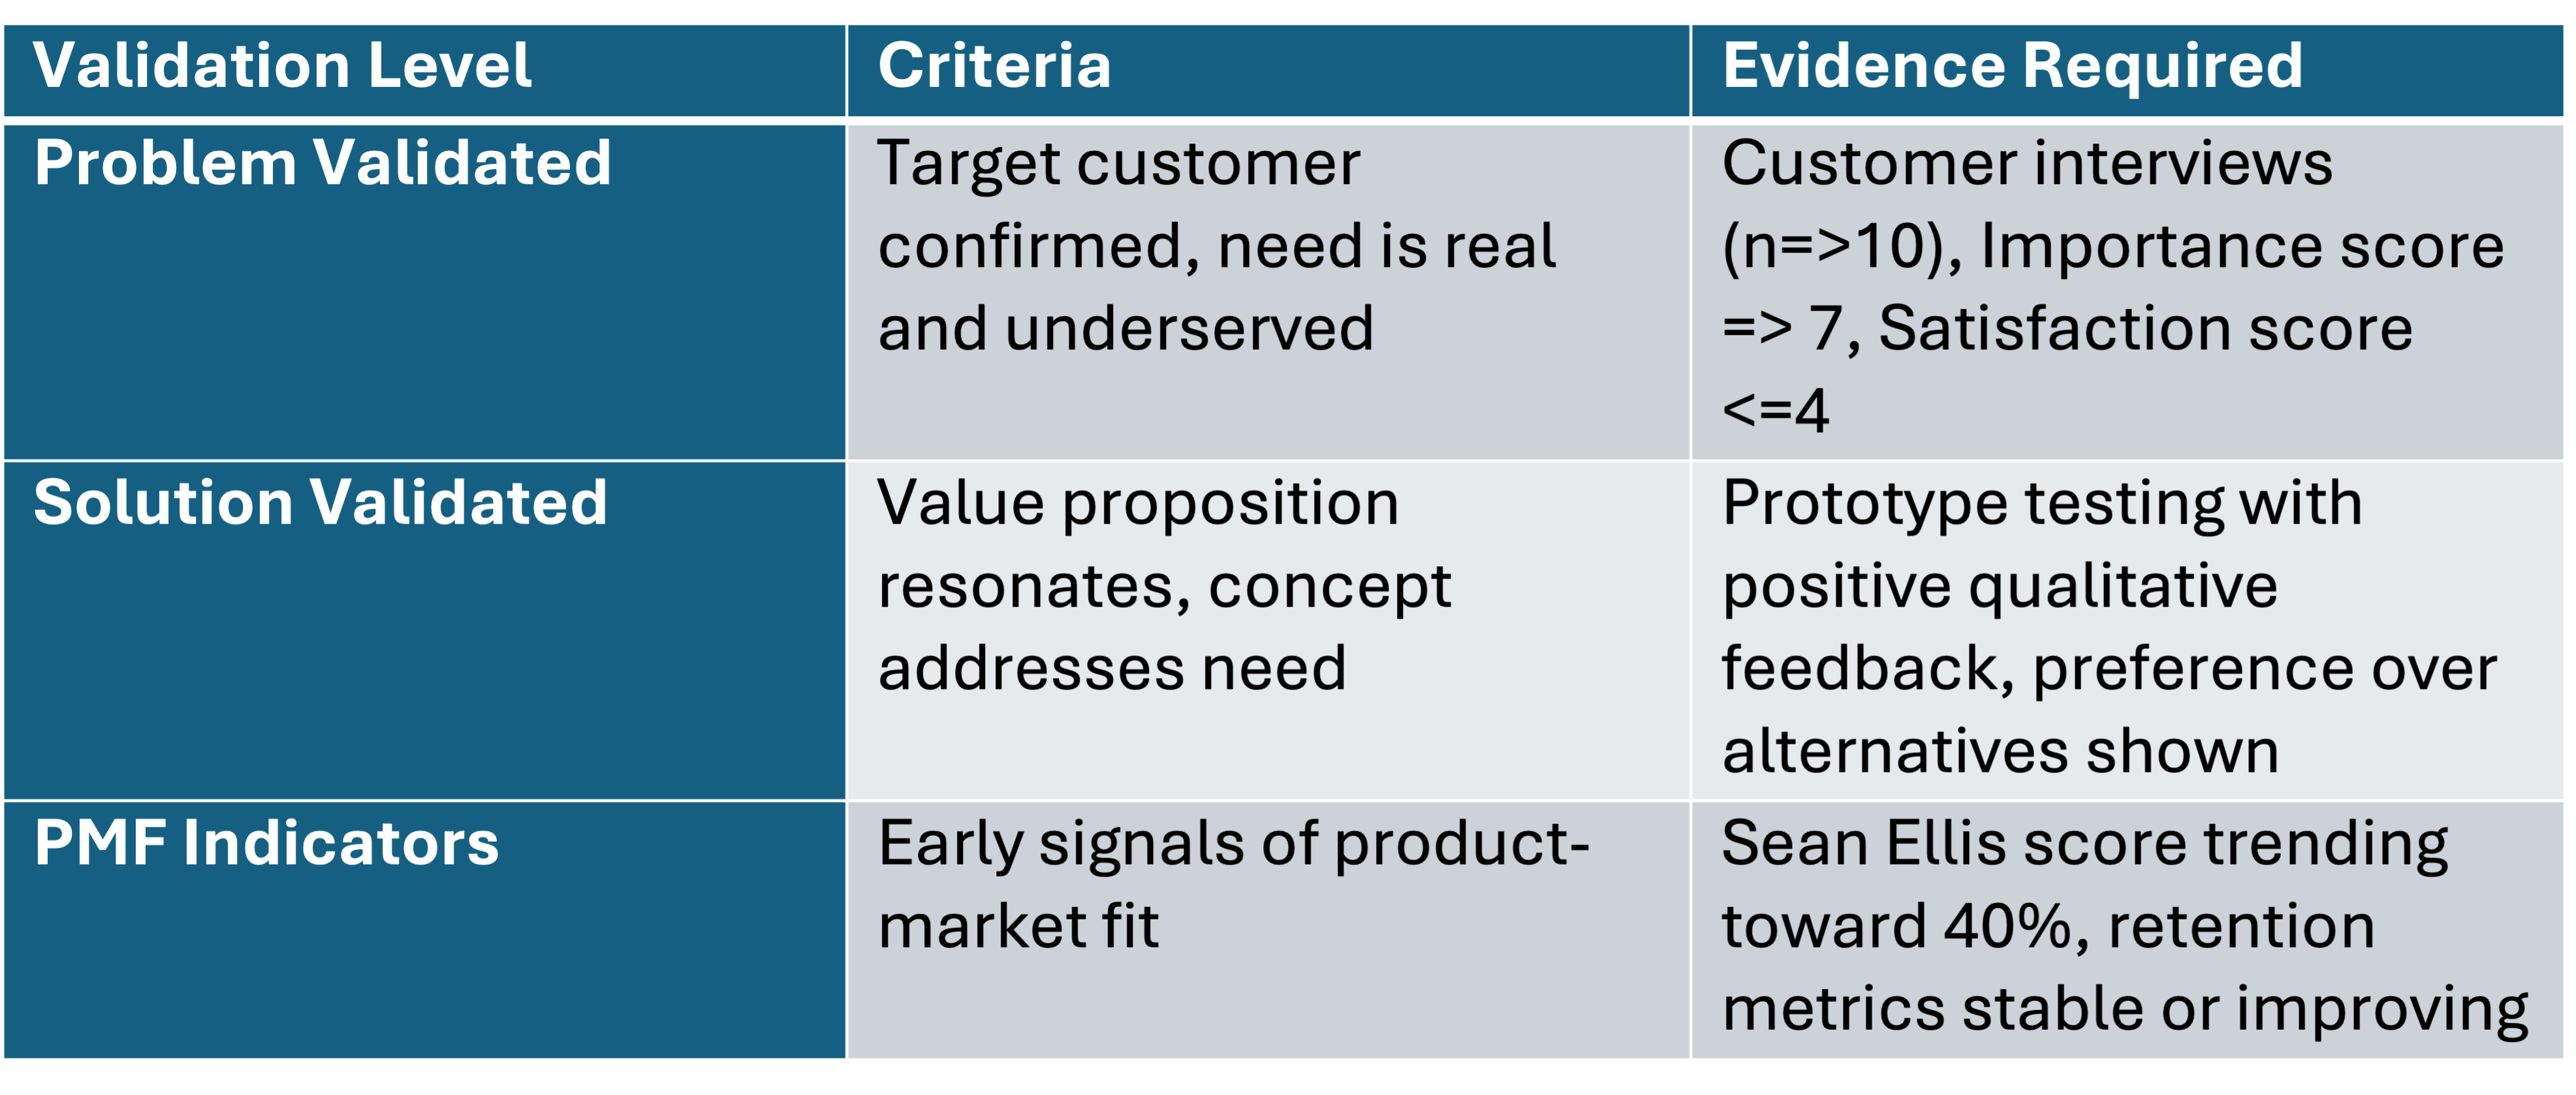
I would suggest the following handoff criteria for example. A feature moves from Discovery to Delivery when:
✅ Target customer is validated and documented (persona exists with research backing)
✅ Problem hypothesis is validated with customer evidence (interviews, Importance ≥7, Satisfaction ≤4)
✅ Value proposition is validated through prototype testing (positive qualitative feedback)
✅ Feature requirements are defined with clear acceptance criteria tied to customer outcomes
✅ Opportunity Score exceeds threshold (organisation-specific, but typically >10)
✅ Strategic alignment confirmed (fits current roadmap themes)
✅ Technical feasibility assessed (no blocking unknowns)
This ensures that delivery teams receive high-quality inputs with validated customer need, not speculative requirements that may be invalidated after significant investment. To minimise context loss it is best that the personnel doing Discovery should be the same people doing Delivery; this could differ in your organisation due to industry practices or regulation or any other contextually relevant factor.
3.3 Integrating Outputs: MVPs as Learning Instruments
In the Logic Model, Outputs are the deliverables produced by activities. The Lean Product integration distinguishes between two types of outputs with different purposes and success metrics:
Learning Outputs (Discovery Track):
Customer interview syntheses and insight reports
Prototype test results (what worked, what didn’t, what we learned)
Validation experiment reports (hypothesis, method, results, conclusions)
Updated hypothesis documents (evolved based on learning)
Journey maps and persona updates
These outputs are measured by learning velocity—how quickly the organisation generates validated customer insights that reduce delivery risk.
Value Outputs (Delivery Track):
Shipped features meeting acceptance criteria
Product releases available to customers
Technical capabilities and infrastructure
Documentation and training materials
Analytics and instrumentation
These outputs are measured by flow metrics—velocity, time, efficiency, load—and quality metrics.
MVP Positioning in the Integrated Framework
MVPs are specifically learning outputs, not value outputs. This distinction matters because it changes how we measure success:
MVP success is measured by validated learning, not adoption or revenue
MVPs should be as low-fidelity as possible while still testing the hypothesis
MVP “failures” (invalidated hypotheses) are valuable—they prevent wasted delivery investment
MVPs that don’t generate clear learning are true failures, regardless of outcome
I have seen organisations treat MVPs as “version 1 products” and measure them by business metrics. This is a failure mode that undermines the discovery process. When MVPs are judged by adoption, teams inflate their scope to increase adoption chances, defeating the “minimum” part of MVP.
An MVP that invalidates a hypothesis before significant delivery investment is a success, not a failure. It saved resources that would have been wasted on a product nobody needs.
3.4 Integrating Outcomes: Connecting Validation to Flow
The Logic Model distinguishes between outputs (what you produce) and outcomes (the changes that result). This is where the Lean Product integration becomes most powerful—by connecting flow metrics to customer validation outcomes.
“How do we measure whether our integrated system is working?”
The integrated framework tracks outcomes at three levels:
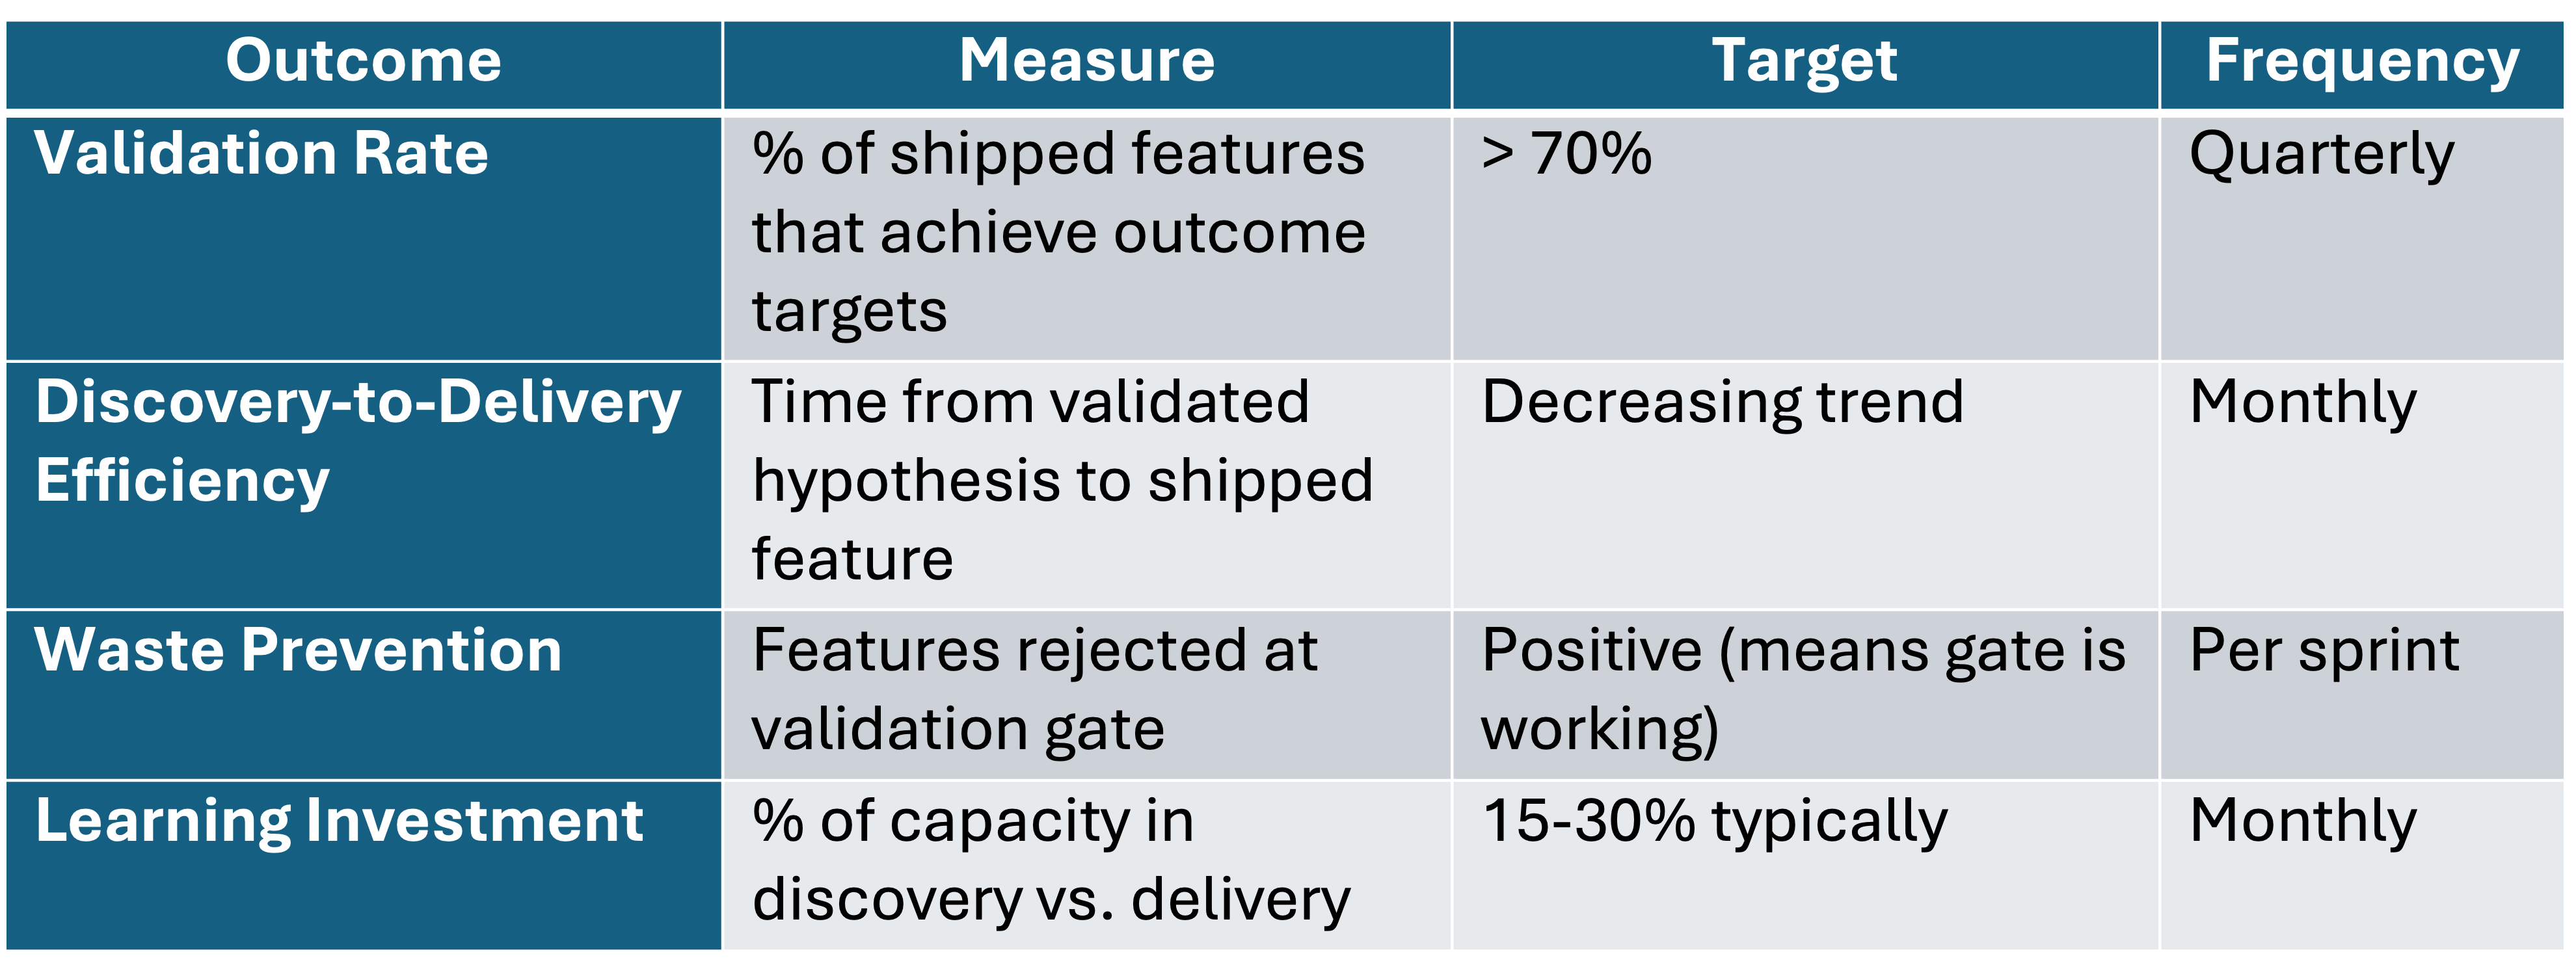
Customer Validation Outcomes (Is the product creating real customer value?)
See example below:
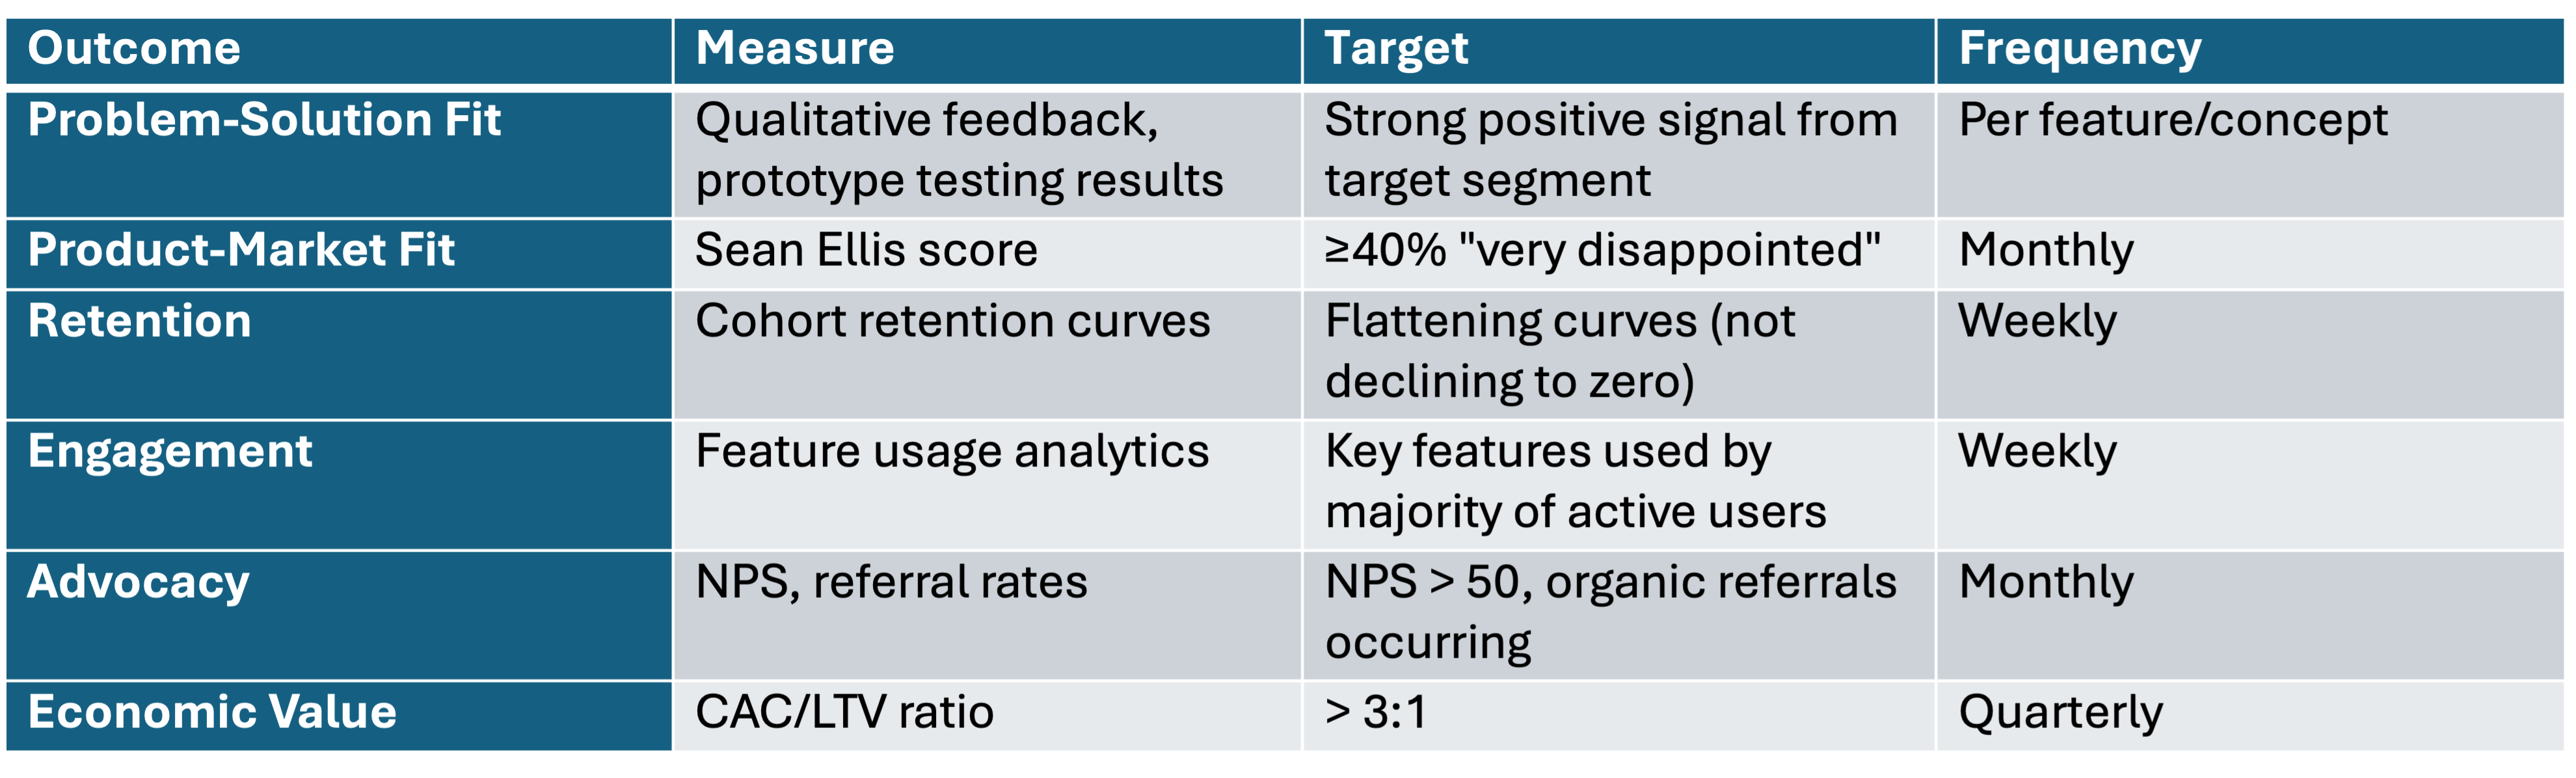
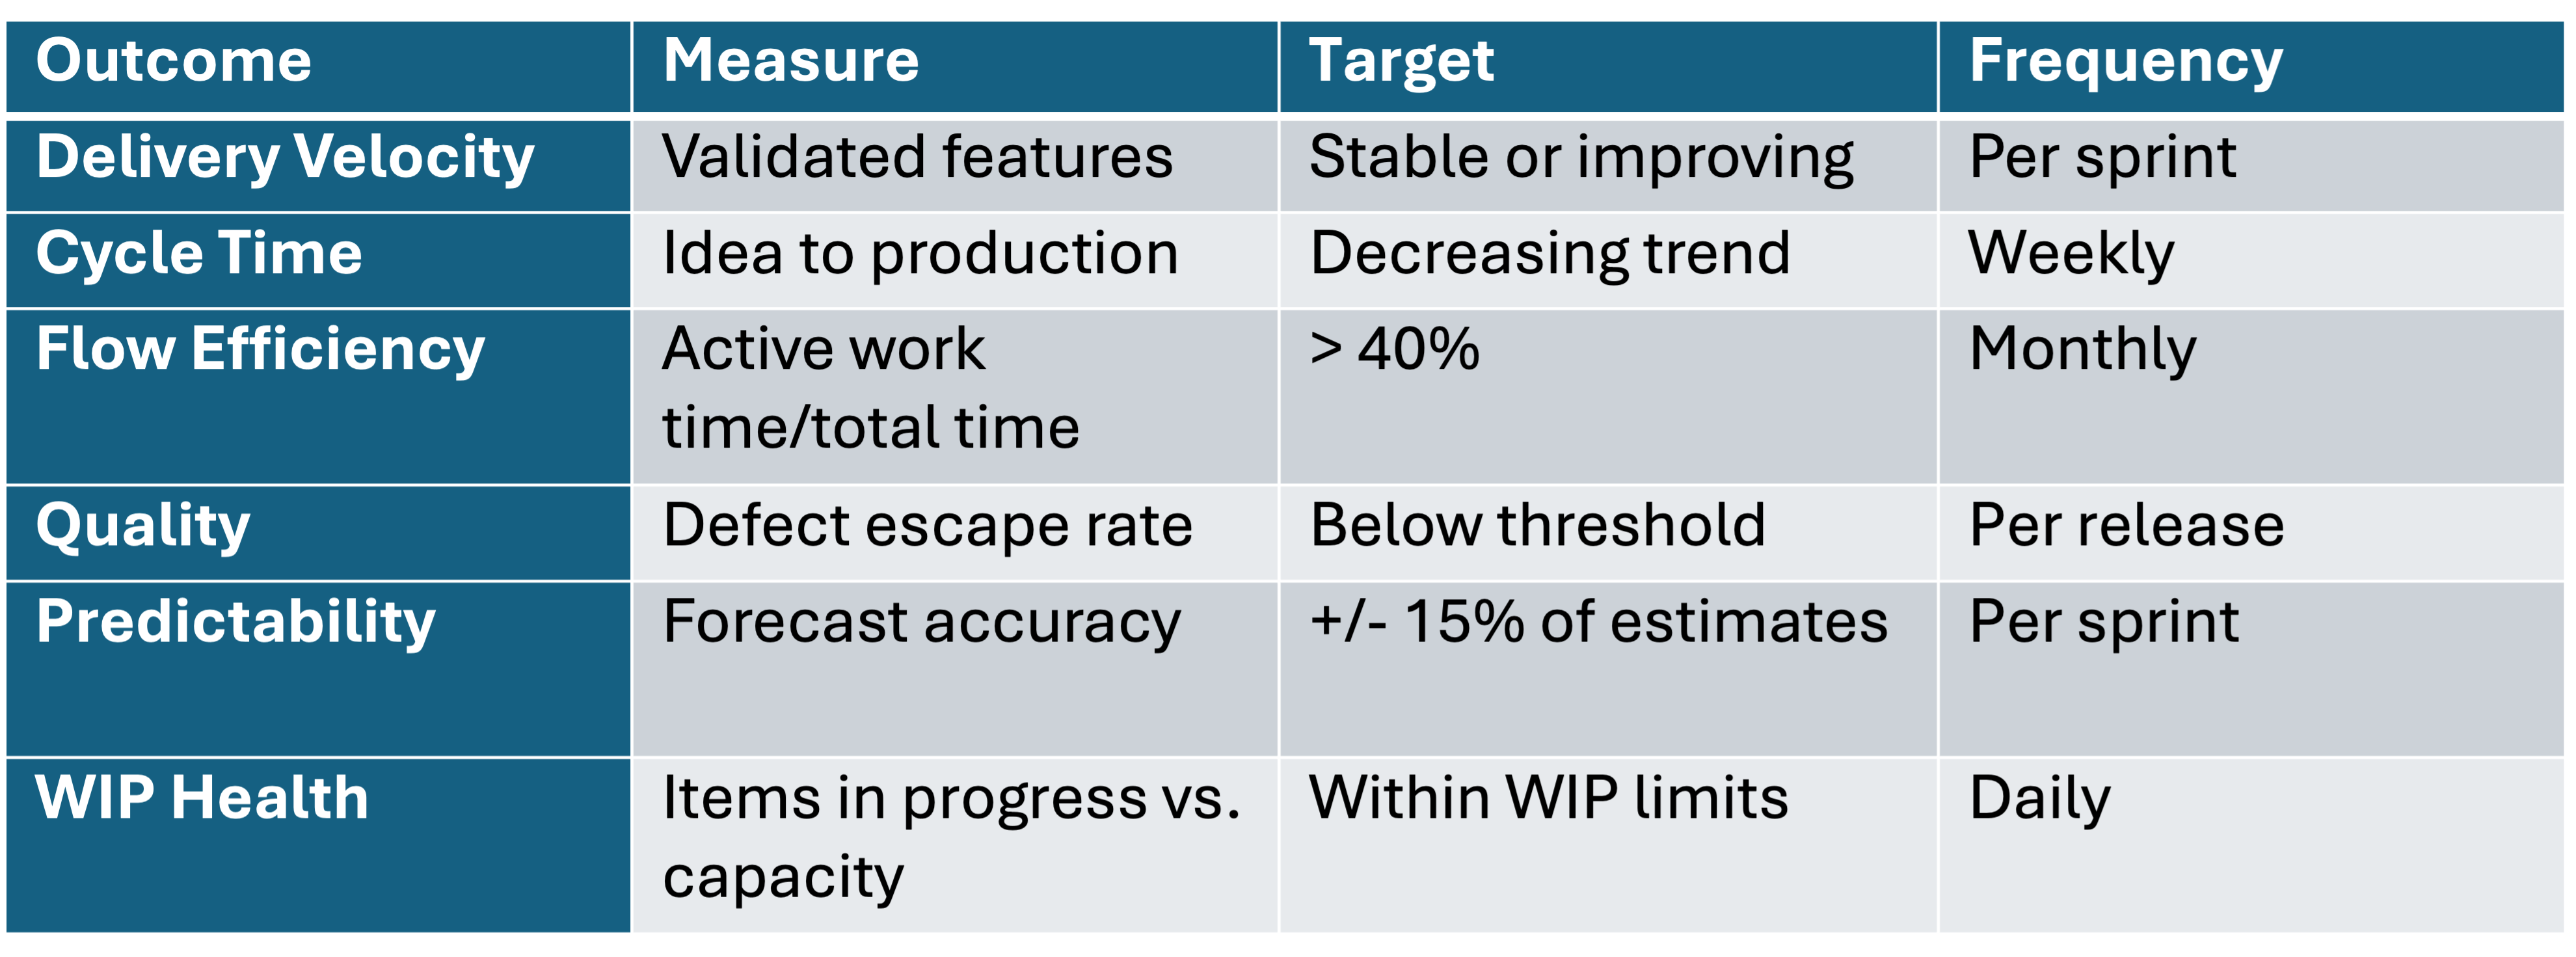
Operational Flow Outcomes (Is the delivery system efficient?):
See example below:
Integrated Outcomes (Are discovery and delivery working together?):
See example below:
The Critical Connection
Flow metrics only matter when connected to customer validation outcomes. Consider this interpretation matrix:
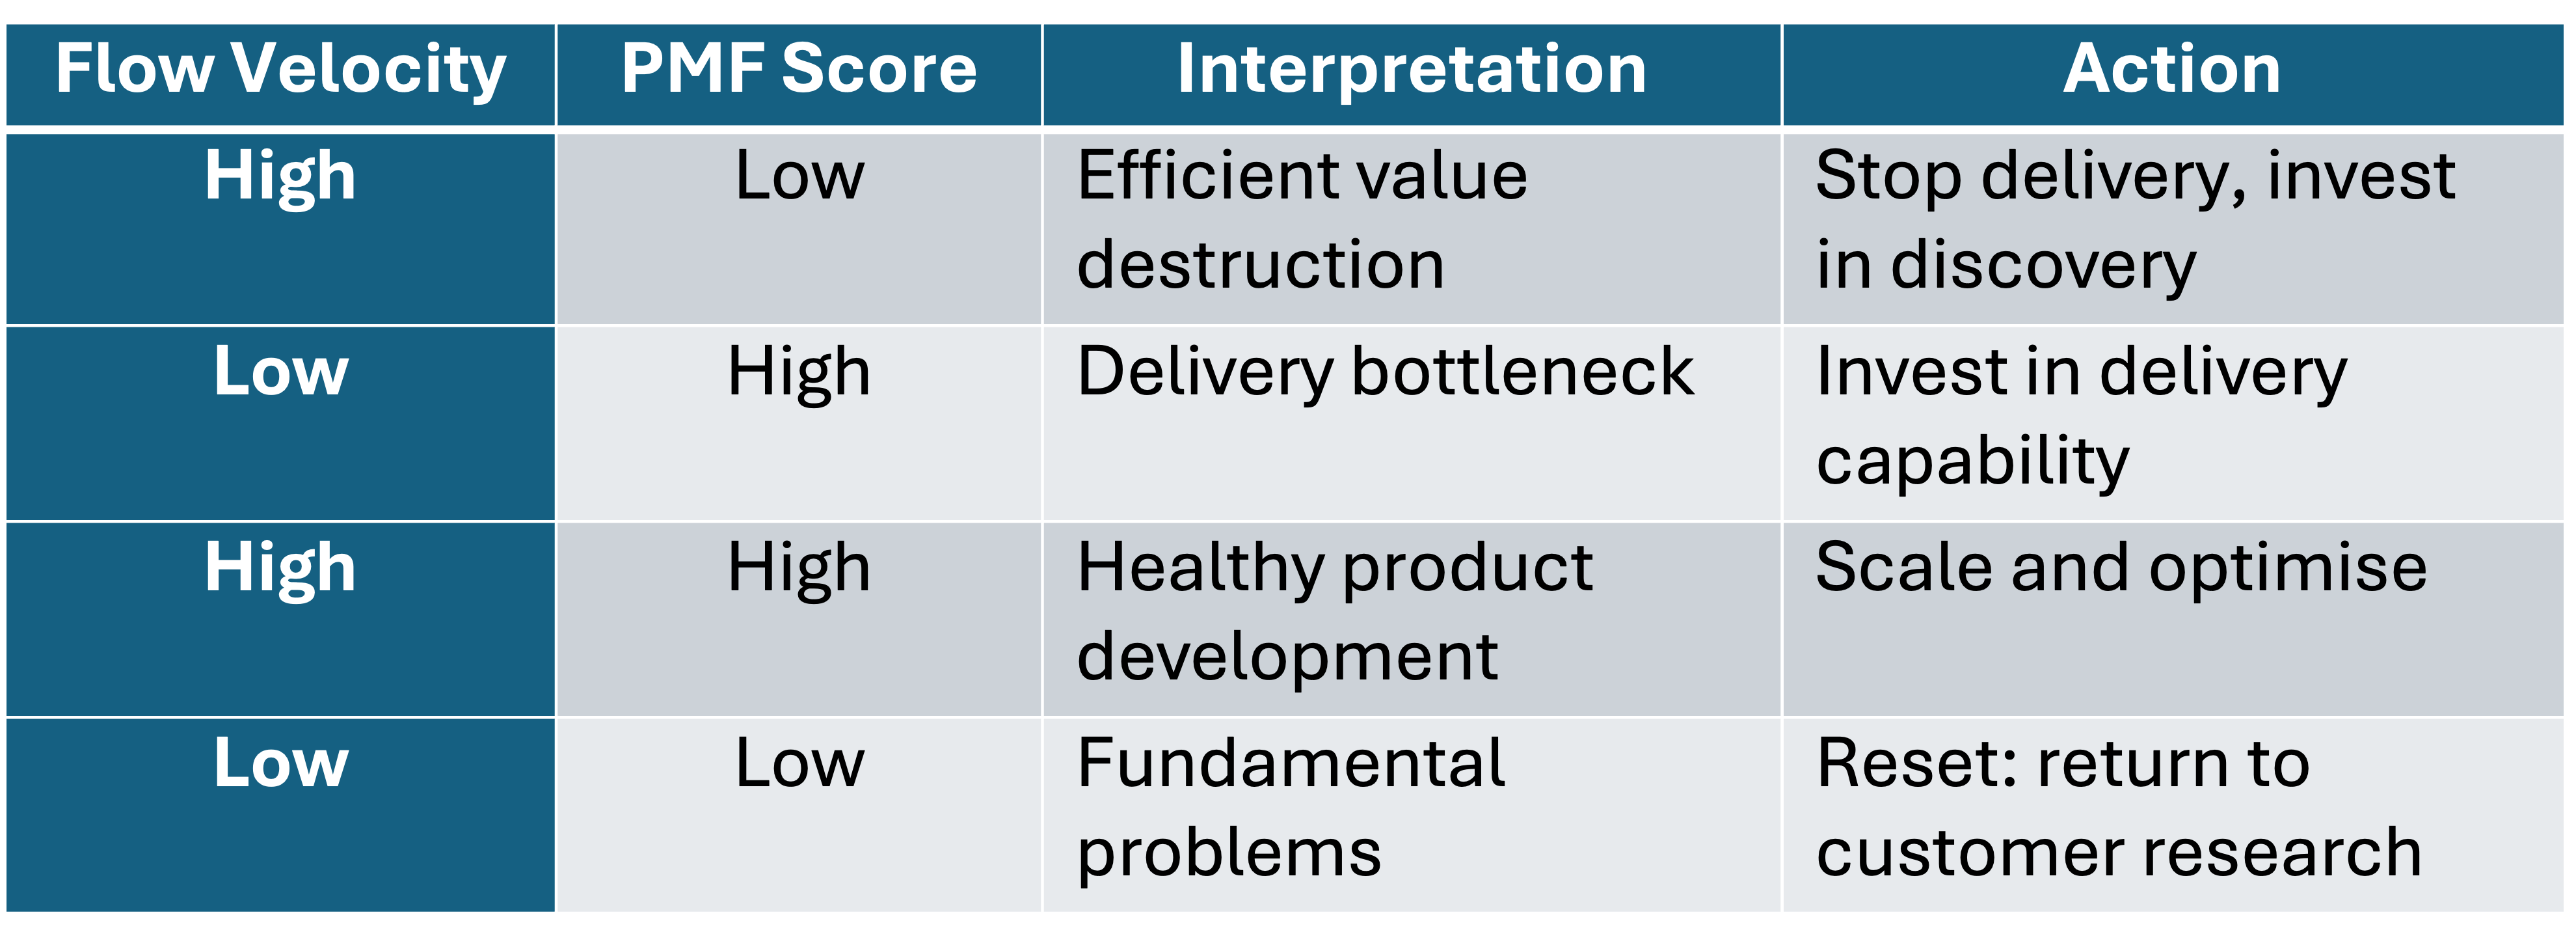
This reframes how we interpret flow metrics. Velocity is not inherently good, it's only good when the features being delivered have validated customer value. The integrated framework makes this connection explicit and measurable.
Part 4: Practical Implementation
“How do we actually implement this integrated framework in a real product organisation?”
Implementation requires changes to team structure, processes, artifacts, and metrics. Let me provide practical guidance for each.
4.1 Team Structure: The Product Trio
Teresa Torres popularised the concept of the Product Trio for many where you have a Product Management ‘Lead’ (PM), a Design ‘Lead’, and an Engineering ‘Lead’ working together on discovery. This structure is essential for the integrated framework because it creates overlap between discovery and delivery.
Product Manager responsibilities include and not limited to:
Generating and validating customer hypotheses (not just receiving requirements)
Maintaining the Importance-Satisfaction matrix for the product area
Ensuring requirements trace to validated needs (gatekeeper role)
Managing the validation gate criteria
Translating customer insights into clear requirements for delivery
Designer responsibilities responsibilities include and not limited to:
Creating testable prototypes for hypothesis validation
Conducting usability testing (Olsen recommends 1-hour sessions: 15-min warmup, 40-min feedback, 5-min wrap)
Distinguishing usability feedback from product-market fit feedback
Participating in customer interviews (not just receiving research readouts)
Engineer responsibilities responsibilities include and not limited to:
Participating in discovery as a trio member (bringing feasibility perspective)
Implementing instrumentation for hypothesis testing and validation
Understanding which features have validated customer value vs. speculation
Contributing technical feasibility input to opportunity scoring
Suggesting technical approaches that enable faster validation
The trio works together on discovery activities, then collaborates with the broader development team for delivery. This structure ensures that the people building the product have direct customer contact and understand the validation evidence behind what they’re building.
4.2 Process Changes: Weekly Cadence
Implementing the integrated framework requires rhythm and ritual. I would suggest the following weekly cadence:
Monday: Discovery Planning
Review current hypotheses in testing
Plan customer interviews and prototype tests for the week
Assess which items are ready to move to delivery
Prioritise discovery work based on strategic importance
Tuesday-Thursday: Discovery + Delivery Execution
Customer interviews (aim for 2-3 per week minimum per product area)
Prototype testing sessions
Synthesis and documentation
Delivery work continues in parallel (standups, development, etc.)
Friday: Integration Meeting
Review validation results from the week
Update Opportunity Scores based on new data
Make formal decisions on items ready to move to delivery (validation gate)
Update delivery backlog based on validated priorities
Retrospective on discovery process
This cadence ensures continuous discovery feeding the delivery system, not discovery as a one-time phase that happens before a project starts.
4.3 Artifacts and Documentation
The integrated framework requires specific artifacts to connect discovery to delivery:
Hypothesis Document Template:
HYPOTHESIS ID: [unique identifier, e.g., H-2024-042]

TYPE: [Customer / Problem / Value Prop / Feature / UX]

RELATED TO: [Which PMF Pyramid layer does this address?]

STATEMENT: “We believe that [target customer] has a need for [job to be done] because [rationale based on evidence or insight].”

VALIDATION CRITERIA: “This hypothesis is validated if [specific measurable outcome]”

INVALIDATION CRITERIA: “This hypothesis is invalidated if [specific measurable outcome]”

TEST METHOD: [Interview / Prototype / MVP / A/B Test / Survey]

SAMPLE SIZE: [How many customers needed for confidence?]

TIMELINE: [When will we complete testing?]

STATUS: [Untested / In Testing / Validated / Invalidated / Needs More Data]

EVIDENCE:

- [Link to interview synthesis]

- [Quantitative data if applicable]

- [Quotes or observations supporting conclusion]

NEXT STEPS:
- If validated, what enters delivery?
- If invalidated, what do we do next?
Opportunity Score Tracker:
Validation Gate Checklist:
FEATURE: [Feature name]

DATE: [Gate review date]

PRE-REQUISITES:

☐ Target customer validated (persona exists with research backing)

☐ Problem validated (Importance ≥7, Satisfaction ≤4, n≥10 interviews)

☐ Value proposition validated (prototype testing positive)

☐ Requirements documented with acceptance criteria

☐ Acceptance criteria tied to customer outcome

SCORING:

☐ Opportunity score exceeds threshold (our threshold: ___)

☐ Strategic alignment confirmed

☐ Feasibility assessed (no blocking unknowns)

DECISION:

☐ APPROVED for delivery

☐ NEEDS MORE VALIDATION (specify what)

☐ REJECTED (specify reason)

APPROVERS: [PM signature] [Design signature] [Engineering signature]
4.4 Metrics Dashboard (Sample)
The integrated dashboard tracks discovery, delivery, and outcomes together:
Discovery Metrics Panel:
Hypotheses tested this week/month (target: x per sprint)
Customer interviews conducted (target: 2-3 per week per product area)
Validation rate (% of hypotheses validated vs. invalidated)
Average time from hypothesis to validation
Validated backlog size (items ready for delivery)
Delivery Metrics Panel:
Flow velocity (validated features shipped per sprint)
Flow time (median cycle time for features)
Flow efficiency (active work % vs. wait time %)
Flow load (WIP count vs. WIP limit)
Quality (defect escape rate, rollback rate)
Outcome Metrics Panel:
Sean Ellis PMF score (trend over last 6 months)
Retention cohorts (this week vs. last month vs. last quarter)
NPS trend
Feature adoption rates for recent releases
Business value delivered (revenue, conversion, etc.)
Integration Health Panel:
% of shipped features with validation evidence
Discovery-to-delivery lead time (hypothesis to production)
Validation gate rejection rate (should be >0, indicates gate is working)
Discovery capacity allocation (% of team time on discovery)
Part 5: Case Studies and Evidence
“What evidence do we have that this integrated approach works in practice?”
Let me share several examples that illustrate the principles and provide evidence for the integration:
5.1 Intuit: Where Dan Olsen Developed His Framework
Intuit, where Olsen led the Quicken team, exemplifies the discovery-delivery integration. Scott Cook, Intuit’s founder, implemented “Design for Delight” (D4D)—a company-wide commitment to customer-driven innovation integrated with operational excellence.
Key practices at Intuit:
“Follow Me Home” research: Engineers and PMs observe customers using products in their natural environment—not just in lab settings
Rapid experimentation: Hypothesis testing before significant development investment; the company ran 1,500 experiments in a single year
Customer-driven prioritisation: Features prioritised by validated customer need, not HiPPO (Highest Paid Person’s Opinion)
Painstorm sessions: Teams focus on understanding customer pain before brainstorming solutions
Cook stated: “I got sick of wasting months and years of engineering time on products that just weren’t going anywhere.”
The result: After implementing these practices, Intuit’s share price rose 55% in one year. The company consistently ranks among the highest in customer satisfaction in its category. TurboTax grew to serve 46 million customers through systematic understanding of their tax preparation jobs to be done.
5.2 Amazon: Working Backwards from the Customer
Amazon’s “Working Backwards” process represents another form of discovery-delivery integration. Before building features, teams write:
Press release: Describes the finished product as if announcing to the world
FAQ: Answers customer and internal questions
Visuals: Mockups of the customer experience
User manual: How customers will use the product
Only after these documents are refined (often through multiple iterations) does development begin. This forces validation of customer need and value proposition before delivery investment.
Jeff Bezos explained the principle:
“Start with the customer and work backwards. We’ve tried to do that at Amazon. The traditional approach is to start with what you’re good at and try to find customers for your capabilities.”
Amazon applies this consistently: the Press Release for Kindle was written years before the product was ready. The PR for AWS was refined through dozens of iterations. This investment in discovery (often months of document iteration) pays off in delivery focus; teams build exactly what was validated, not whatever emerges from development.
5.3 Airbnb: Continuous Discovery at Scale
Airbnb demonstrates continuous discovery integrated with operational excellence at scale. In their early days, founders Brian Chesky and Joe Gebbia:
Personally photographed listings (testing hypothesis that photo quality affected booking rates—it did, significantly)
Lived as guests to understand the customer journey firsthand
Conducted extensive host interviews to understand supply-side needs
Ran manual operations (”concierge MVP”) before automating
These discovery practices didn’t stop as Airbnb scaled. The company maintains dedicated research teams that continuously validate customer needs, feeding insights into product delivery. They famously track the entire customer journey and measure “moments of truth“, critical experiences that determine satisfaction.
The integration is visible in their metrics: Airbnb tracks both operational flow (booking completion rates, search-to-book conversion, time to first booking for new hosts) and customer validation (NPS, repeat booking rates, host satisfaction, guest reviews).
5.4 Academic Validation: The Camuffo Study
The most rigorous evidence comes from academic research. In 2019, Arnaldo Camuffo and colleagues published a randomised control trial in Management Science studying 116 Italian startups over two years.
The treatment group received training in scientific hypothesis-testing methods—essentially Lean Product methodology covering:
Hypothesis articulation
Experimental design
Evidence evaluation
Pivot decision-making
The control group used traditional approaches based on intuition and opportunism.
Findings:
Hypothesis-driven startups performed significantly better on revenue and other business metrics
They pivoted more effectively when initial hypotheses were invalidated (earlier and more decisive pivots)
They made better resource allocation decisions, investing more in validated opportunities
The effect was strongest for startups in uncertain markets—where discovery matters most
Trained founders were more likely to abandon non-viable ideas early, saving resources
This provides experimental evidence that hypothesis-driven approaches outperform intuition—validation for the discovery side of the integrated framework. This shows how product development benefits from variability in terms of the arrival or creation of new information.
Part 6: Failure Modes and How to Avoid Them
“What are the common ways this integration fails, and how do we prevent them?”
In my experience, several failure modes undermine the integrated approach.
Understanding these helps you design defences:
6.1 Failure Mode: Discovery Theater
Symptom: Teams go through the motions of customer research but don’t actually use findings to inform decisions. Interviews are conducted, but features ship regardless of feedback. Research becomes a checkbox rather than a decision input.
Root Cause: Organisational pressure to ship features overrides discovery insights. Leaders have already decided what to build; research is performed to validate pre-existing conclusions or to tick a process box.
Prevention:
Tie discovery to economic outcomes (quantify the Cost of Delay for unvalidated features)
Make the validation gate non-negotiable, no exceptions for “urgent” features without explicit risk acknowledgment
Executive sponsorship for discovery practices (leaders must model the behaviour)
Make discovery findings visible to executives before decisions are made, not after
Track and celebrate validated learning, not just shipped features
6.2 Failure Mode: Analysis Paralysis
Symptom: Teams conduct endless research but never feel confident enough to move to delivery. More interviews are always needed. More prototype iterations are always required. The perfect becomes the enemy of the good.
Root Cause: Perfectionism or risk aversion. Teams seek 100% certainty before acting. Or teams use discovery as a shield against accountability, if we’re still researching, we can’t be blamed for shipping something that fails.
Prevention:
Set explicit validation criteria upfront (before testing begins), what evidence would be sufficient?
Time-box discovery phases with forcing functions (e.g., “decision by Friday regardless”)
Accept that some uncertainty is inherent, the goal is sufficient validation, not certainty
Use the “reversibility” principle: reversible decisions need less validation than irreversible ones
Celebrate speed of learning, not just quality of learning
6.3 Failure Mode: Metric Gaming
Symptom: Teams optimise metrics without creating real value. Discovery metrics (interviews conducted) or delivery metrics (velocity) become targets rather than indicators. Teams run low-quality interviews to hit a number, or split features to inflate velocity.
Root Cause: Goodhart’s Law, ”When a measure becomes a target, it ceases to be a good measure.” Also, metrics without context create perverse incentives.
Prevention:
Focus on outcome metrics (PMF score, retention, NPS) as the ultimate measure
Use flow metrics and discovery metrics as diagnostics, not performance targets
Regular qualitative review alongside quantitative metrics, leaders should periodically review actual interview notes, not just interview counts
Avoid tying individual performance evaluation directly to these metrics
6.4 Failure Mode: Dual-Track Disconnect
Symptom: Discovery and delivery tracks operate independently. Discovery generates insights that don’t influence delivery. Delivery ships features that weren’t validated. The two tracks pass like ships in the night.
Root Cause: Organisational silos, research team is separate from product team. Or lack of integration mechanisms, no regular handoff process. Or tool fragmentation, insights live in research tools that product teams don’t access.
Prevention:
Product Trio structure ensures overlap between tracks (same people do both)
Weekly integration meeting to connect discovery findings to delivery priorities
Shared OKRs that span both discovery (hypotheses validated) and delivery (features shipped)
Unified tooling where hypotheses, validation evidence, and delivery items are connected
Hypothesis ID traceability—every delivery item links to the hypothesis it addresses
6.5 Failure Mode: Ignoring the Market Layers
Symptom: Teams focus on product layers (features, UX) while neglecting market layers (customer, needs). Beautiful products that nobody needs. Sophisticated features solving the wrong problem.
Root Cause: Teams are more comfortable with product work (which they control and understand) than market research (which requires customer access and tolerates ambiguity). Engineering cultures especially gravitate toward solutions.
Prevention:
Start every initiative at the bottom of the PMF Pyramid—who is the customer? what is the underserved need?
Require customer evidence before feature requirements are accepted
Regular exposure to customers for all team members (not just researchers and PMs)
Make the pyramid visible—literally post it in the team space as a reminder
Retrospectives that ask: “Did we validate the market layers before investing in product layers?”
6.6 Failure Mode: Validation Inflation
Symptom: The bar for “validated” gets lower over time. Teams claim validation with less and less evidence. “We talked to three customers and they liked it” becomes sufficient.
Root Cause: Pressure to move faster creates incentive to lower the bar. Success breeds confidence that skipping validation is acceptable. New team members don’t understand the rigour expected.
Prevention:
Document validation standards explicitly (sample sizes, criteria, methods)
Validation gate review by someone outside the immediate team
Periodic audits of validation evidence quality
Onboarding that emphasises validation rigour
Tracking validation-to-outcome connection—do well-validated features perform better?
Closing Remarks: From Insight to Action to Impact
The integration of Dan Olsen’s Lean Product Playbook with the Product Development Operating Model addresses the full cycle of product development: discovering what’s worth building and building it efficiently.
Neither framework alone suffices.
Lean Product methodology without operational rigor produces validated ideas that never ship—the graveyard of product development is full of beautiful prototypes and compelling customer insights that never became real products. Discovery without delivery is just research.
Operational excellence without discovery discipline produces efficiently delivered features that customers don’t need; the costliest form of waste because it consumes resources while destroying value. Delivery without discovery is just busyness.
The integrated framework creates explicit connections:
Validated hypotheses become inputs to the delivery system, replacing arbitrary requirements with evidence-backed needs
Flow metrics measure delivery of validated work only, making efficiency meaningful
Customer outcome metrics provide ultimate accountability for both discovery and delivery teams
The dual-track structure ensures continuous flow in both directions—insights feeding delivery, delivery generating data for new insights
If there is one thing you remember from this article, let it be this:
‘Efficient delivery of unvalidated features is efficient value destruction.’
Every feature that enters your delivery system should have passed through systematic customer validation. Every flow metric should be interpreted in the context of whether the flowing work has validated customer value. Every team should ask not just “how fast are we shipping?” but “are we shipping things customers need?”
In a sense, the integration is obvious in retrospect. Of course we should validate before building. Of course we should measure delivery efficiency only for valuable work. But the obvious is not always the practiced, and making the integration explicit—with specific processes, artifacts, and metrics—transforms philosophy into way of work.
The statistics I cited at the beginning — 42% failing for lack of market need, 70-74% failing from premature scaling — represent the cost of not integrating discovery and delivery. The research showing 3x better outcomes for hypothesis-driven teams represents the opportunity from getting it right.
The choice is yours: continue optimising parts of the system in isolation, or integrate discovery and delivery into a coherent whole that systematically produces products customers value.
I know which approach great operators choose.
Post Script: Additional Considerations
On Scaling Discovery
As organisations grow, maintaining continuous discovery becomes challenging. Some approaches I have seen work:
Embedded researchers: Each product team has a dedicated researcher who maintains customer relationships and research infrastructure
Research operations: Centralised support for recruiting participants, scheduling sessions, and managing research tools—allowing product teams to focus on conducting research
Customer advisory boards: Regular access to a panel of engaged customers who provide ongoing feedback
Democratised research: Training all team members in basic discovery techniques so research doesn’t bottleneck on specialists
Continuous feedback loops: In-product mechanisms (surveys, feedback buttons) that supplement deliberate research
On the Role of Intuition
While I have emphasised hypothesis-driven approaches, intuition still has a role. Experienced product leaders develop pattern recognition that can identify opportunities faster than formal research.
The key is using intuition to generate hypotheses, not to replace validation. A PM’s gut feeling that customers need something becomes a hypothesis to test, not a feature to build. As Olsen notes, great product people are both rigorous and intuitive—they use data to validate their instincts, not to override them blindly.
On Market Context
The integrated framework is context dependent. In some markets (e.g., regulated industries, long enterprise sales cycles), discovery cycles may be longer and validation criteria different. In others (e.g., consumer apps, viral products), faster iteration is possible and expected.
Adjust the cadence and validation thresholds to your market reality. The principles remain constant; the parameters are contextual.
On Existing Products versus New Products
The Lean Product Playbook is often associated with new product development and startups. The reality however is that the principles apply equally to established products. Existing products need continuous discovery to:
Identify new underserved needs as markets evolve
Validate that planned enhancements address real needs
Understand why customers are churning
Find expansion opportunities with adjacent segments
The integration with the operating model is perhaps even more important for established products, where the delivery machinery already exists but may be churning out features without validation discipline.
Post Post Script:
Before you go, please could you do the following?
Subscribe
Thanks for reading Prod Dev! Subscribe for free to receive new posts and support my work.
Share
Survey
Star
If you got value from reading the article a star liking would be highly appreciated!
Resources
Books
The Lean Product Playbook by Dan Olsen — The primary source for the discovery framework covered in this article
Continuous Discovery Habits by Teresa Torres — Essential reading on maintaining discovery cadence and the Product Trio structure
The Principles of Product Development Flow by Donald Reinertsen — The theoretical foundation for flow-based delivery and economic decision-making
Inspired and Empowered by Marty Cagan — Practical guidance on product team structure, dual-track development, and product leadership
Project to Product by Mik Kersten — Introduction to the Flow Framework and flow metrics
Jobs to Be Done by Tony Ulwick — Deep dive on Outcome-Driven Innovation and the importance-satisfaction framework
The Lean Startup by Eric Ries — The foundation for hypothesis-driven development and MVP thinking
Playing to Win by Roger Martin — Strategic framework that complements product strategy and value proposition development
Escaping the Build Trap by Melissa Perri — Product management practices for outcome-focused development
Articles and Talks
Dan Olsen’s Mind the Product San Francisco Talk — Video presentation of core Lean Product concepts
Dual-Track Agile by Marty Cagan — The origin and explanation of the dual-track concept
The Sean Ellis Test — Detailed explanation of the 40% PMF threshold and how to implement the survey
My previous article: Measure Twice and Cut Once: Products, Planning and Predictability — The Product Development Operating Model foundation this article builds upon
Frameworks Referenced
Product-Market Fit Pyramid (Dan Olsen)
Kano Model (Noriaki Kano)
Jobs to Be Done / Outcome-Driven Innovation (Clayton Christensen, Tony Ulwick)
Logic Model (W.K. Kellogg Foundation)
Flow Framework (Mik Kersten)
Dual-Track Agile (Marty Cagan)
Importance-Satisfaction / Opportunity Scoring (Tony Ulwick, Dan Olsen)
Sean Ellis PMF Survey (Sean Ellis)
Research
Camuffo, A., Cordova, A., Gambardella, A., & Spina, C. (2019). A Scientific Approach to Entrepreneurial Decision-Making: Evidence from a Randomized Control Trial. Management Science, 66(2), 564-586.
Videos on Lean Product Playbook
Review of Lean Product Playbook
How to find Product-Market Fit?
Minimum Viable Product